Demand
Forecast Deviation Report: monitor the accuracy of your planning
The Forecast Deviation Report is a free web-based tool that allows you to compare your demand forecasts with the actual demand that occurred. It is designed to help you monitor forecast quality, identify significant deviations, detect biases and generate an executive report ready for use in your S&OP cycle.
To get started, upload a CSV file containing data for the current month. This file is mandatory and must include at least a column for the reference, a column for the forecast, and a column for the actual data. You may also include a column for the product family if you want to analyse results by product group or category.
Optionally, you can upload a second CSV file with data from the previous month. This comparison allows you to assess the forecast’s evolution and see whether the error has improved, worsened, or remained stable between periods. For reliable analysis, both files must have the same structure and use the same measurement criteria.
It is important to work with closed data. This means you should compare the forecast generated before the analysed period with the actual demand of that same period. For instance, to analyse March, use the forecast finalised before March began and compare it with March’s actual demand. This prevents distortion from forecasts recalculated during the month.
Once the data is uploaded, the tool automatically generates a deviation report. The report includes an executive summary, error classification by type, a comparison with the previous month, a ranking of references with the largest deviations, a detailed table, and automatic recommendations for the next S&OP cycle. You can also export the report in HTML format for internal sharing or to use in planning meetings.
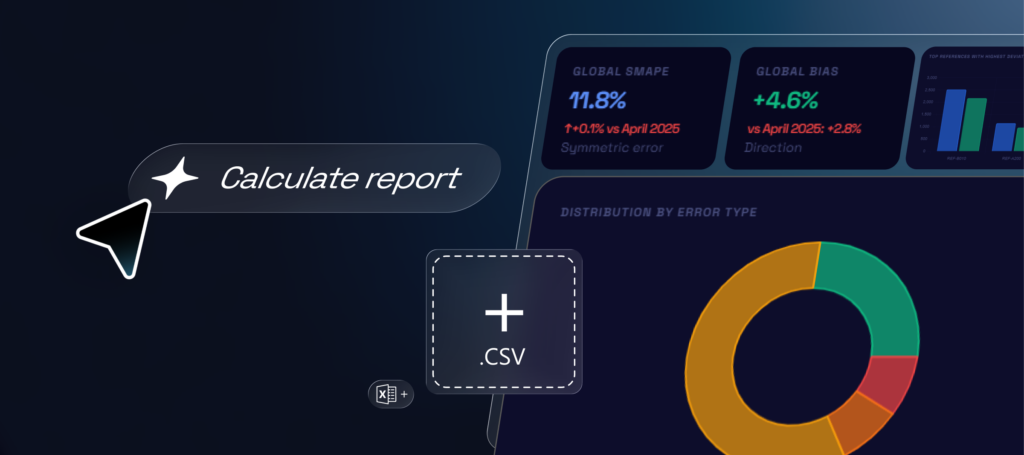
The executive summary allows you to review the main forecast indicators. The global sMAPE measures the percentage error of the forecast; the global BIAS indicates whether forecasts systematically overestimate or underestimate demand; and the global MAE shows the mean absolute error. You will also see the number of references analysed, total forecast and total actual demand.
Next, the tool classifies references according to the type of error detected. You can identify accurate, overestimated, underestimated, highly variable or moderately erroneous references. This classification helps prioritise analysis, focusing first on the references with the greatest potential impact on planning.
The report also includes various visualisations for quick interpretation. The error-type distribution chart provides an overview of forecast quality. The ranking of references with the largest deviations compares forecast versus actual to highlight the products with the greatest differences. The sMAPE evolution by reference allows you to compare the current month with the previous month, quickly showing which references have improved or worsened.
Finally, you can access the detailed table to analyse each reference individually. This table displays the forecast, actual data, deviation, BIAS%, sMAPE% and assigned error type. This information allows you to detect specific patterns, identify critical references and define corrective actions.
As a result, you gain a clear and actionable view of your forecast’s quality. The tool helps you identify deviations, detect biases, compare month-on-month evolution, and prioritise actions to improve your demand forecasting and planning process.
Access the tool online now and keep your forecast under control to make better decisions.